How to Use Candlestick Patterns to Uncover Bullish and Bearish Indicators
Modern online traders use various digital tools to conduct advanced technical analyses. However, some of the most popular means were invented before trading went online. We mean candlestick patterns. They have been around since the 18th century. They were first used in Japan and their functions haven’t changed a lot since then – identification and prediction of the behavior of prices on financial markets. In this short review, we will try to explain how candlestick patterns might be applied to uncover bullish and bearish indicators. Let’s get down to business!
Introduction
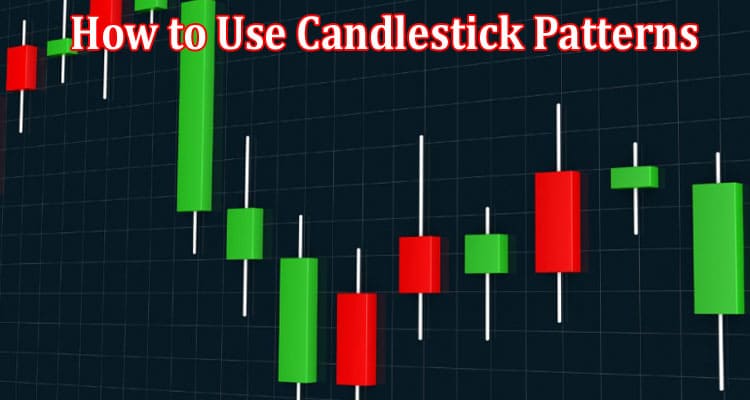
These charts are quite popular among beginners and experienced users. This is because they provide a lot of valuable and useful information. Plus, this data is available in a very simple form. This is how they look on charts:
- When the closing value exceeds the opening, candles are green or white.
- When the opening value is above closing, candles are red or black.
- The rising and low prices are indicated by parts known as “shadows” or “wicks”. These are the parts of candles that are located above and below the real body.
The most common function of these patterns is to give a trader a clue – whether indicators suggest buying or selling. There are many variations of candlesticks and they are used for specific purposes:
- Bearish candles suggest that the upward movement is up to come to an end.
- Bullish candles indicate the downward trend is going to be over.
- Some candles simply reflect indecision among market participants.
- Some bullish or bearish patterns require several specific candles to be detected.
One of the reasons why this type of charting is so popular is because it might be applied in all time frames. This means that you can conduct efficient technical research with the help of different instruments. Additionally, these patterns are the same across different markets. You can use them to predict further price movements when trading stocks, currency pairs, indices, futures, and even cryptos. The principle of their use is the same across different trading markets and platforms. This is why traders combine these patterns with advanced technical instruments. Although no one can guarantee a profit, such a strategy increases your chances to make profitable deals.
Why the design of a chart is important when trading online
The design is very helpful and informative. Unlike line charts, candlestick charting gives pieces of data regarding the open, high, low, and close of each time period. With this, it’s easier to realize current conditions and predict further trends. As we’ve mentioned before, all these pieces of information are contained in just two parts of a candle – its body and wicks. The wide body of each candle is formed between the opening and closing prices of the bar. It will be colored red if the indicators suggest the declining price movement of your asset. If the trend is upward, the candle will be colored green. This is how charting can simply inform traders about the price trends at the moment.
The wicks of the candle are also important for your analysis, Their extensions indicate the highest and lowest prices recorded between opening and closing. If these prices are identical the candle won’t have any wicks, just a body. The body can have different forms as well. It depends on the trends in the value fluctuations of the product. For instance, if the open and close are the same, you will see the candle’s body in a form of a flat line.
Identifying Candlestick Patterns
So at this stage of our review, you should know how to identify bullish and bearish indicators from the form, color, and shadows of the candle. The most popular shapes of these patterns are “morning star”, “hammer’, and “Doji candles”. The more complex the pattern is, the more data it contains. However, if you are a complete beginner in online trading, you might not need all the complex variations of candles. You can use the simplest hammer candlestick patterns, such as inverted, hanging man, and shooting start, in order to identify bullish and bearish trends.